Advisors: Prof. Zhiru Zhang, Yizhao Gao
Spring 2026 - MoE Inference Profiling & Roofline Analysis on 8×H100 GPUs
Phase 1: Real-Hardware Profiling
Profiled five models to track decode latency. Found that the slowest GPU consistently took ~33% longer on compute per layer than the fastest GPU due to token routing skew.
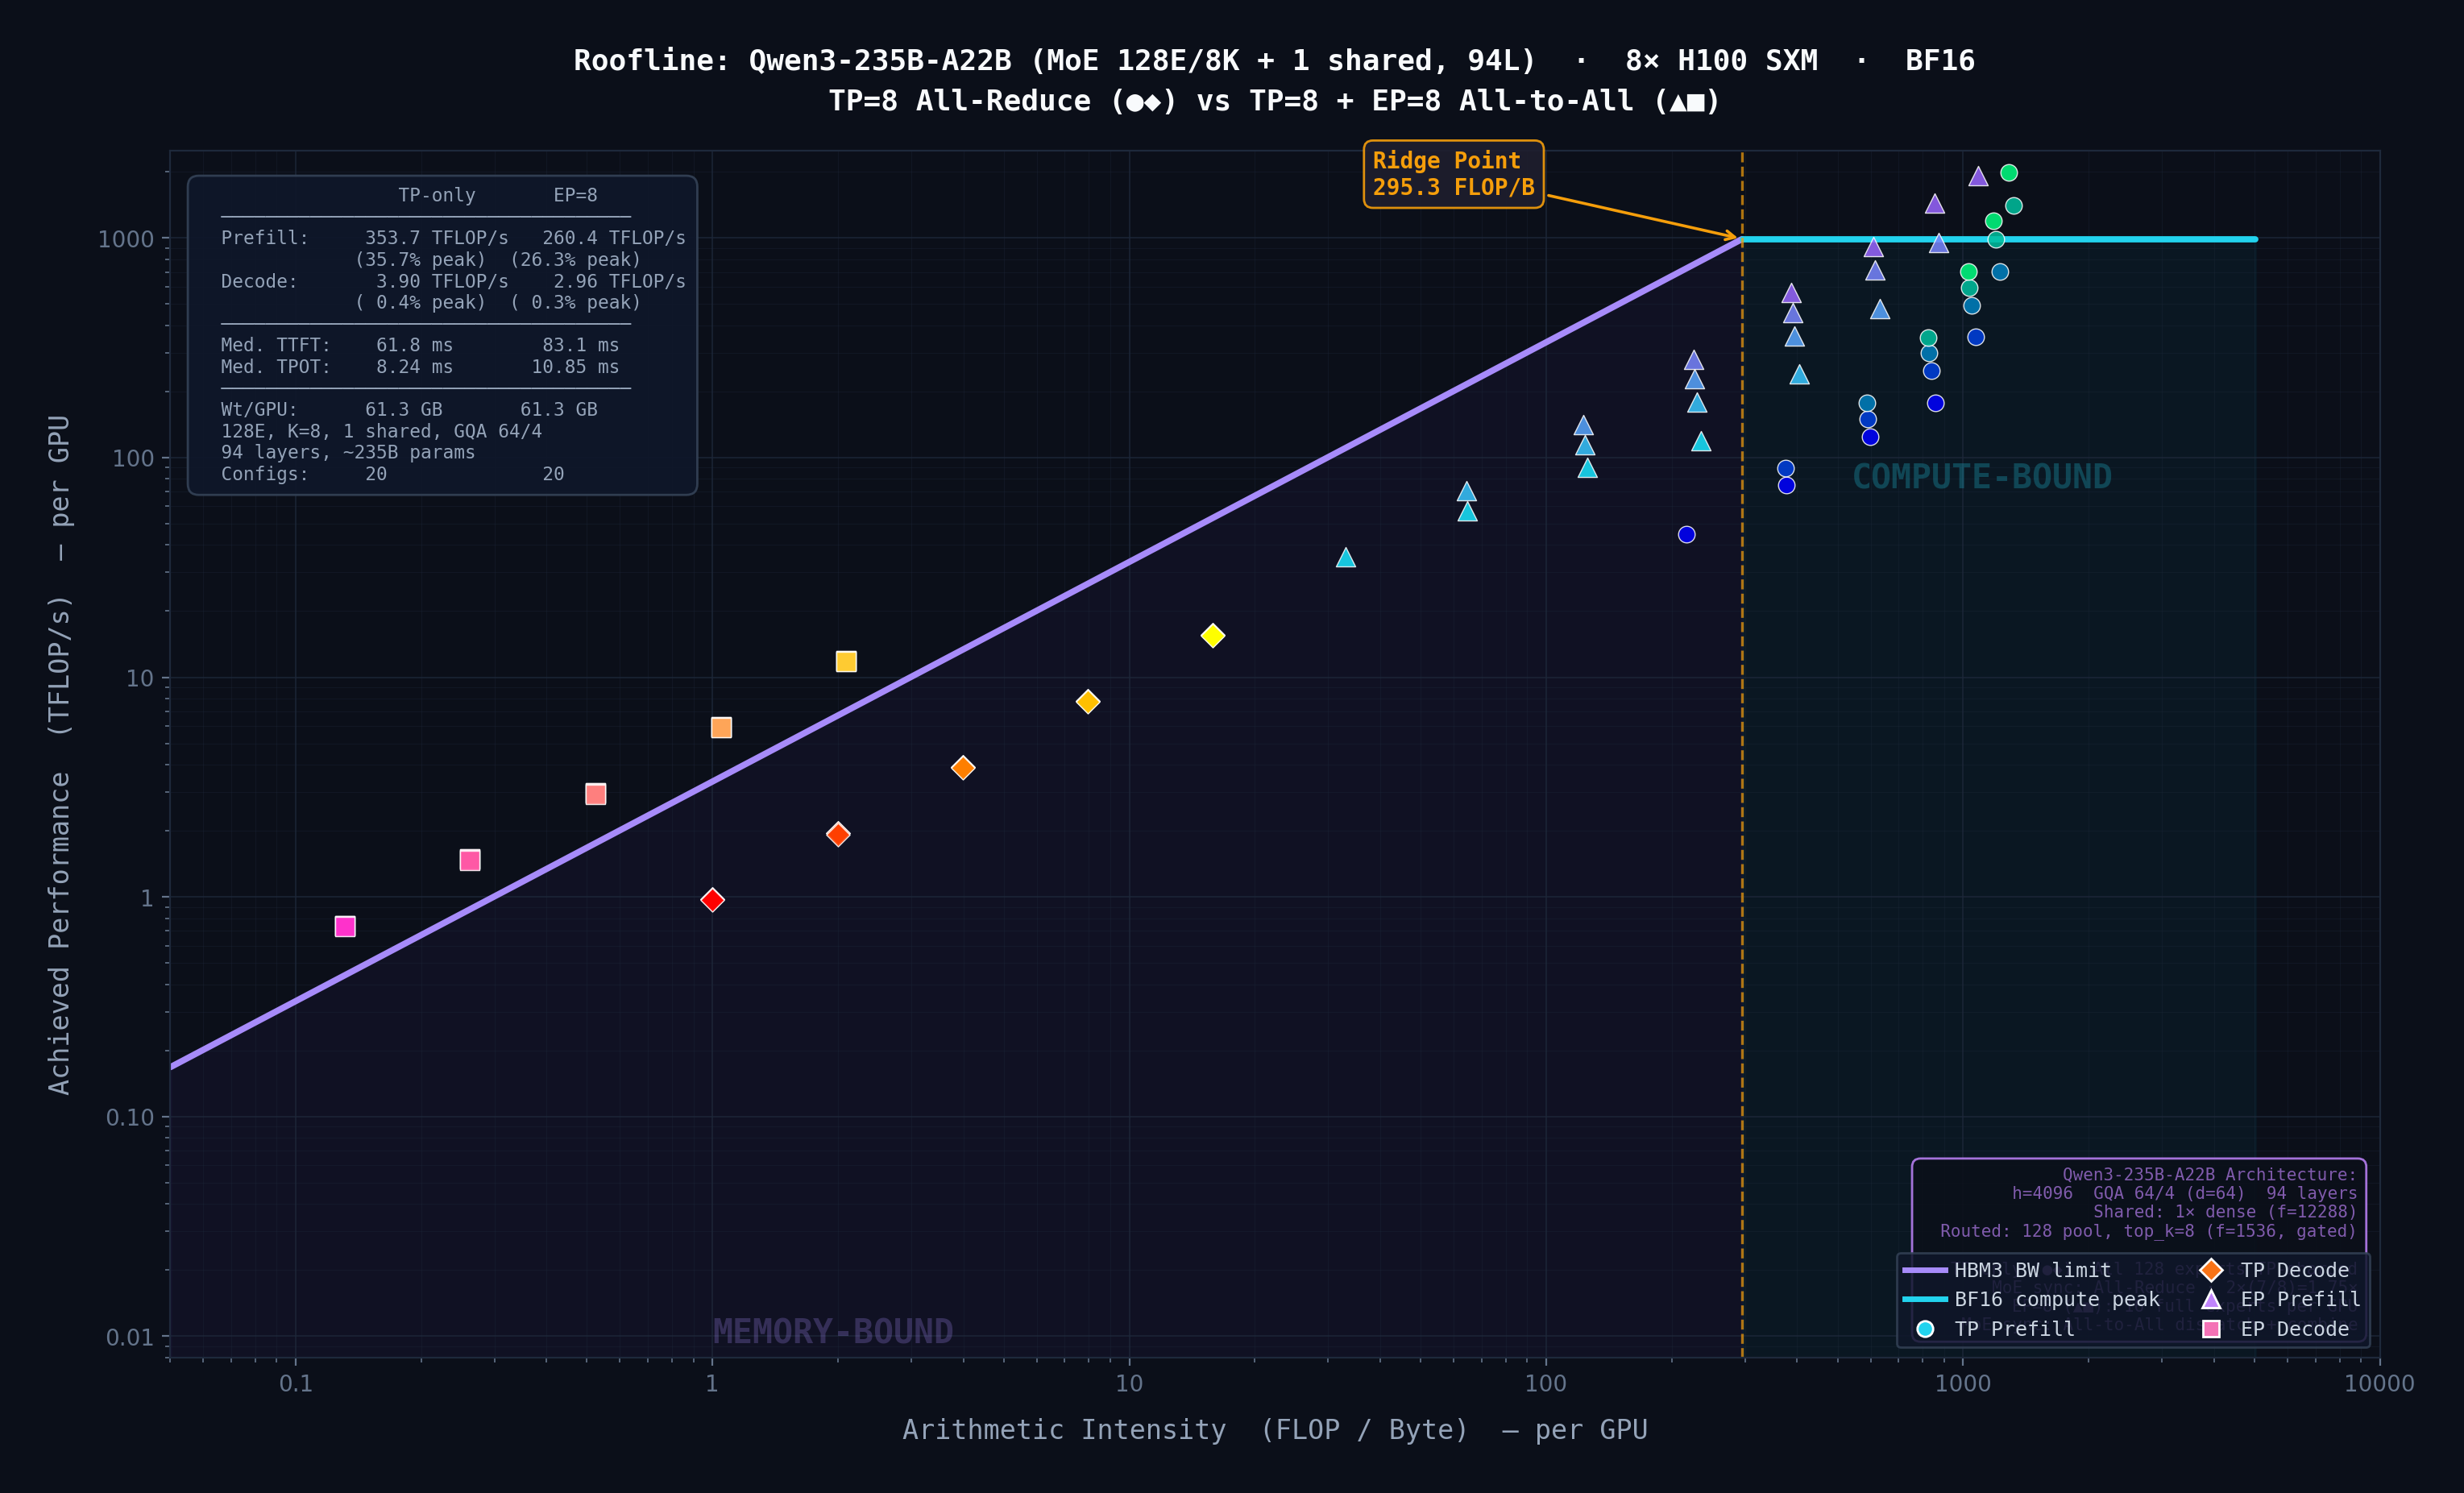
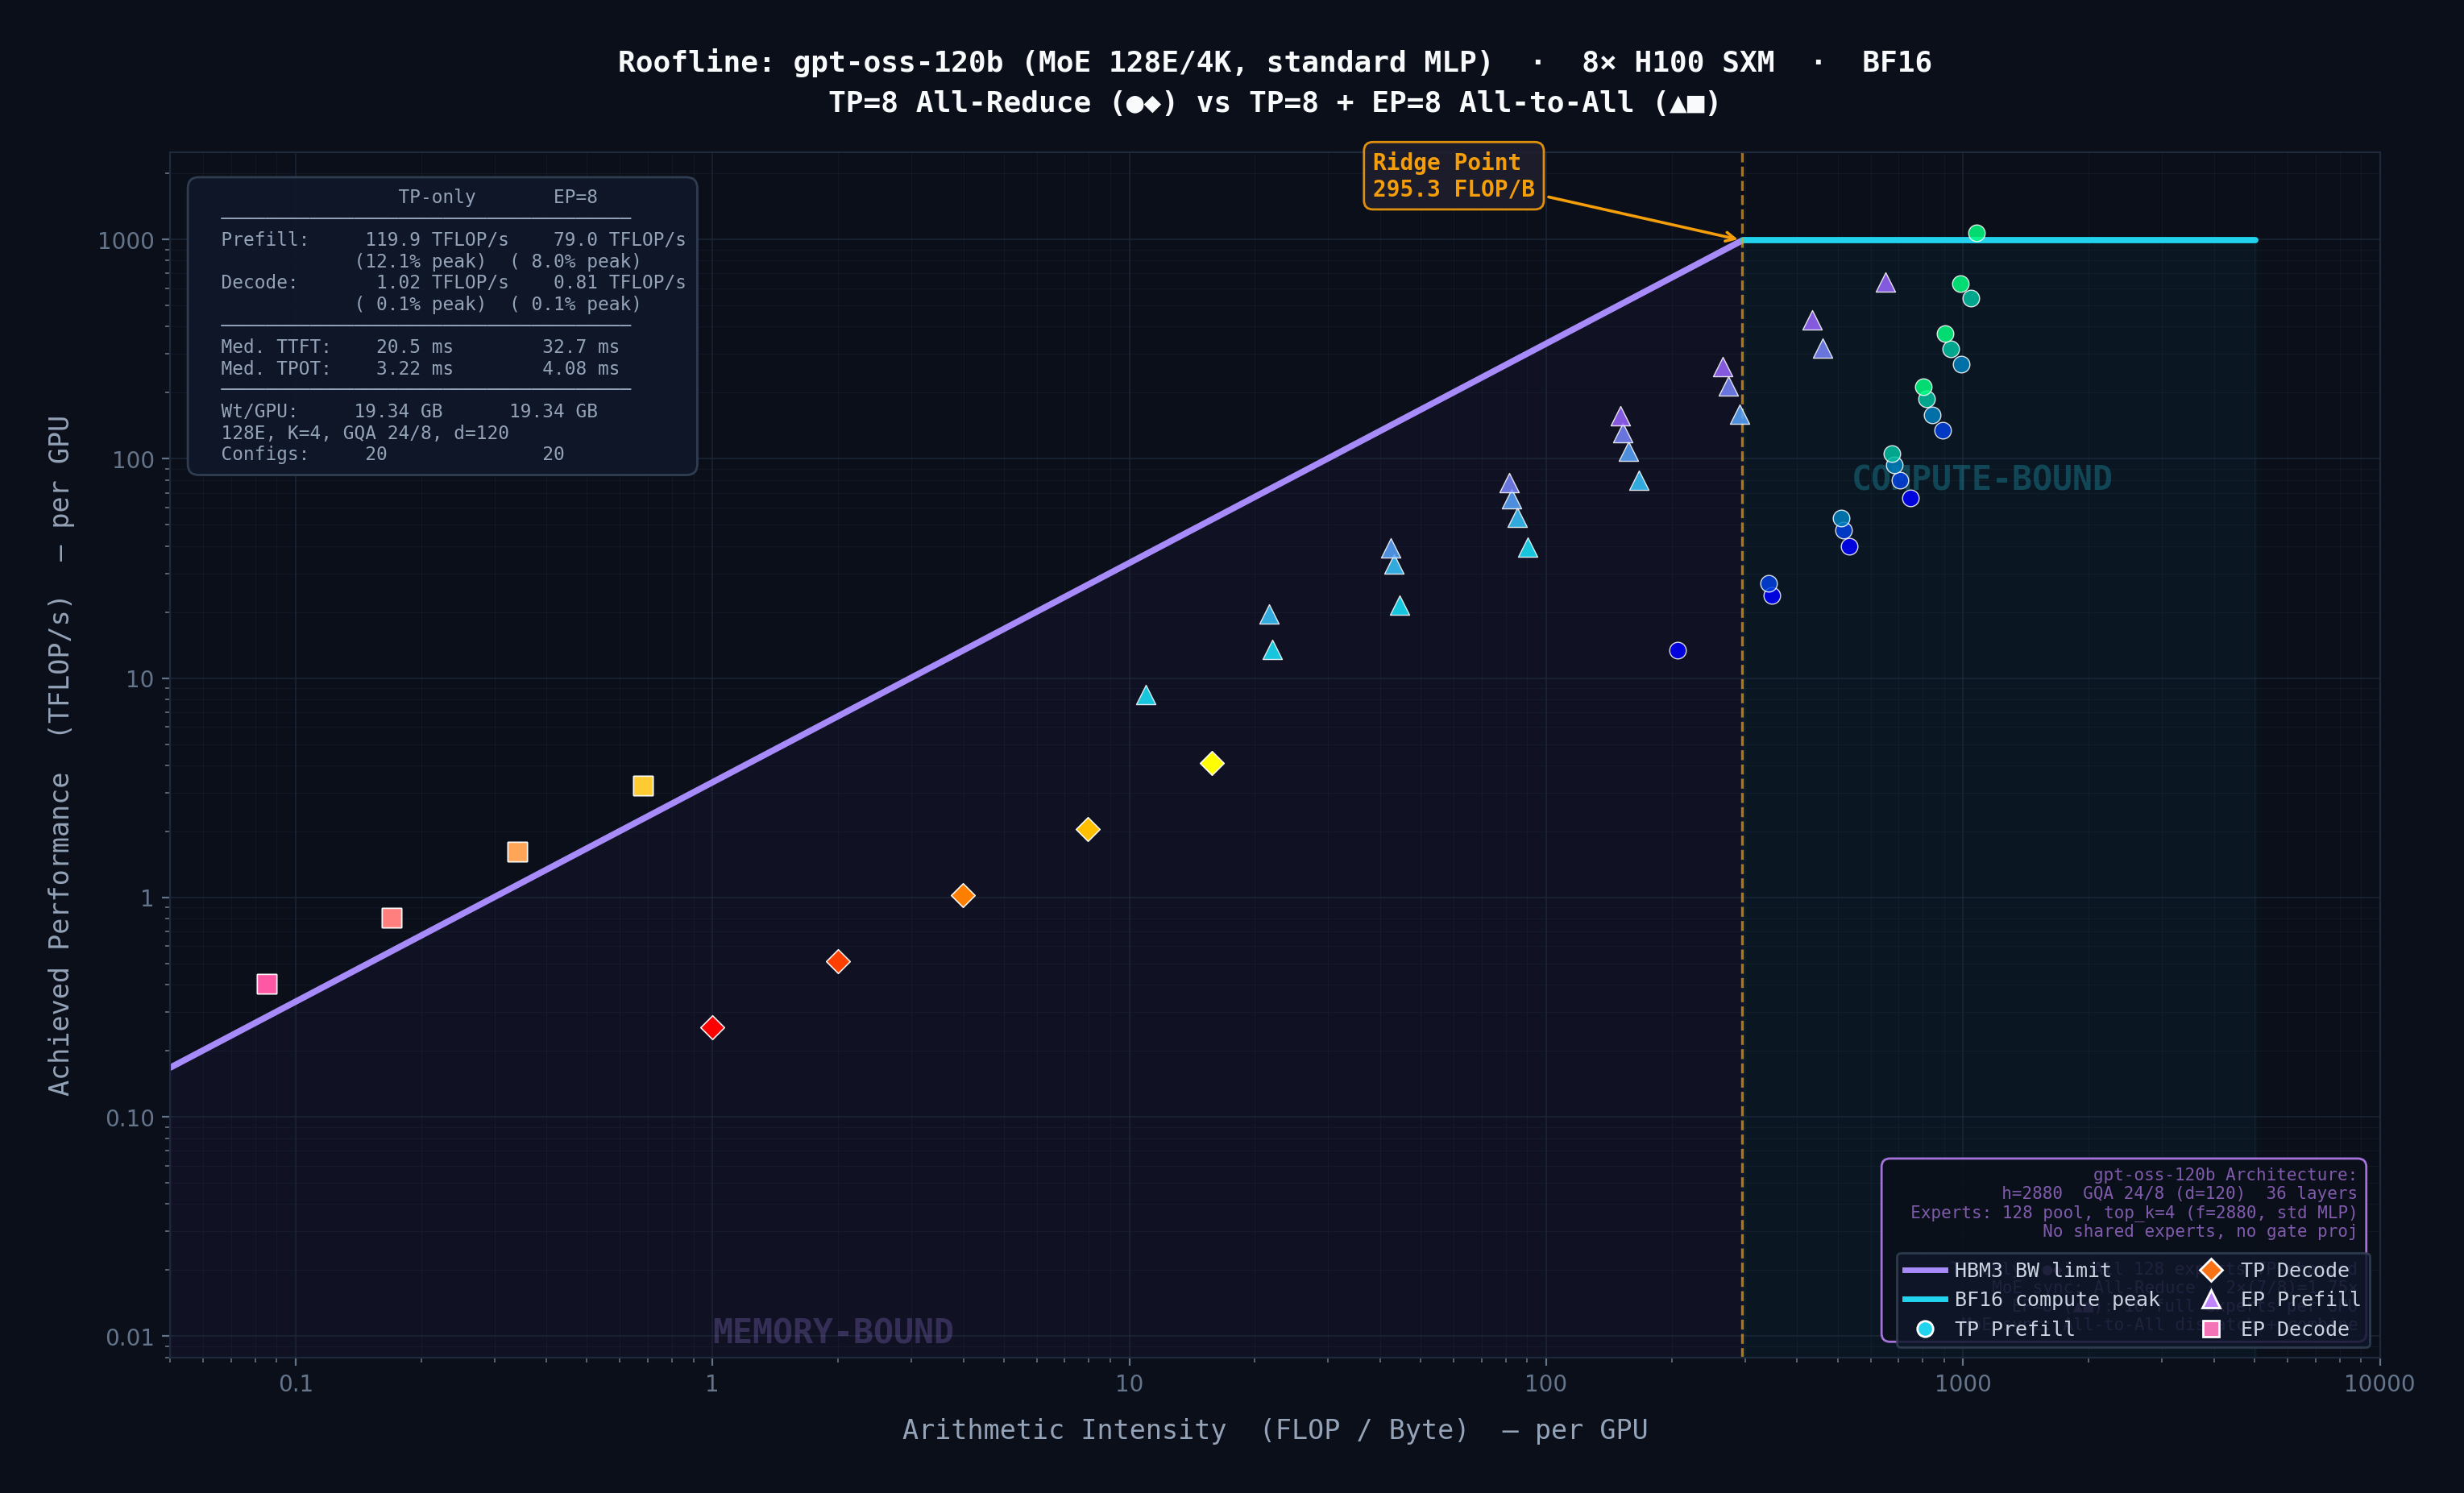
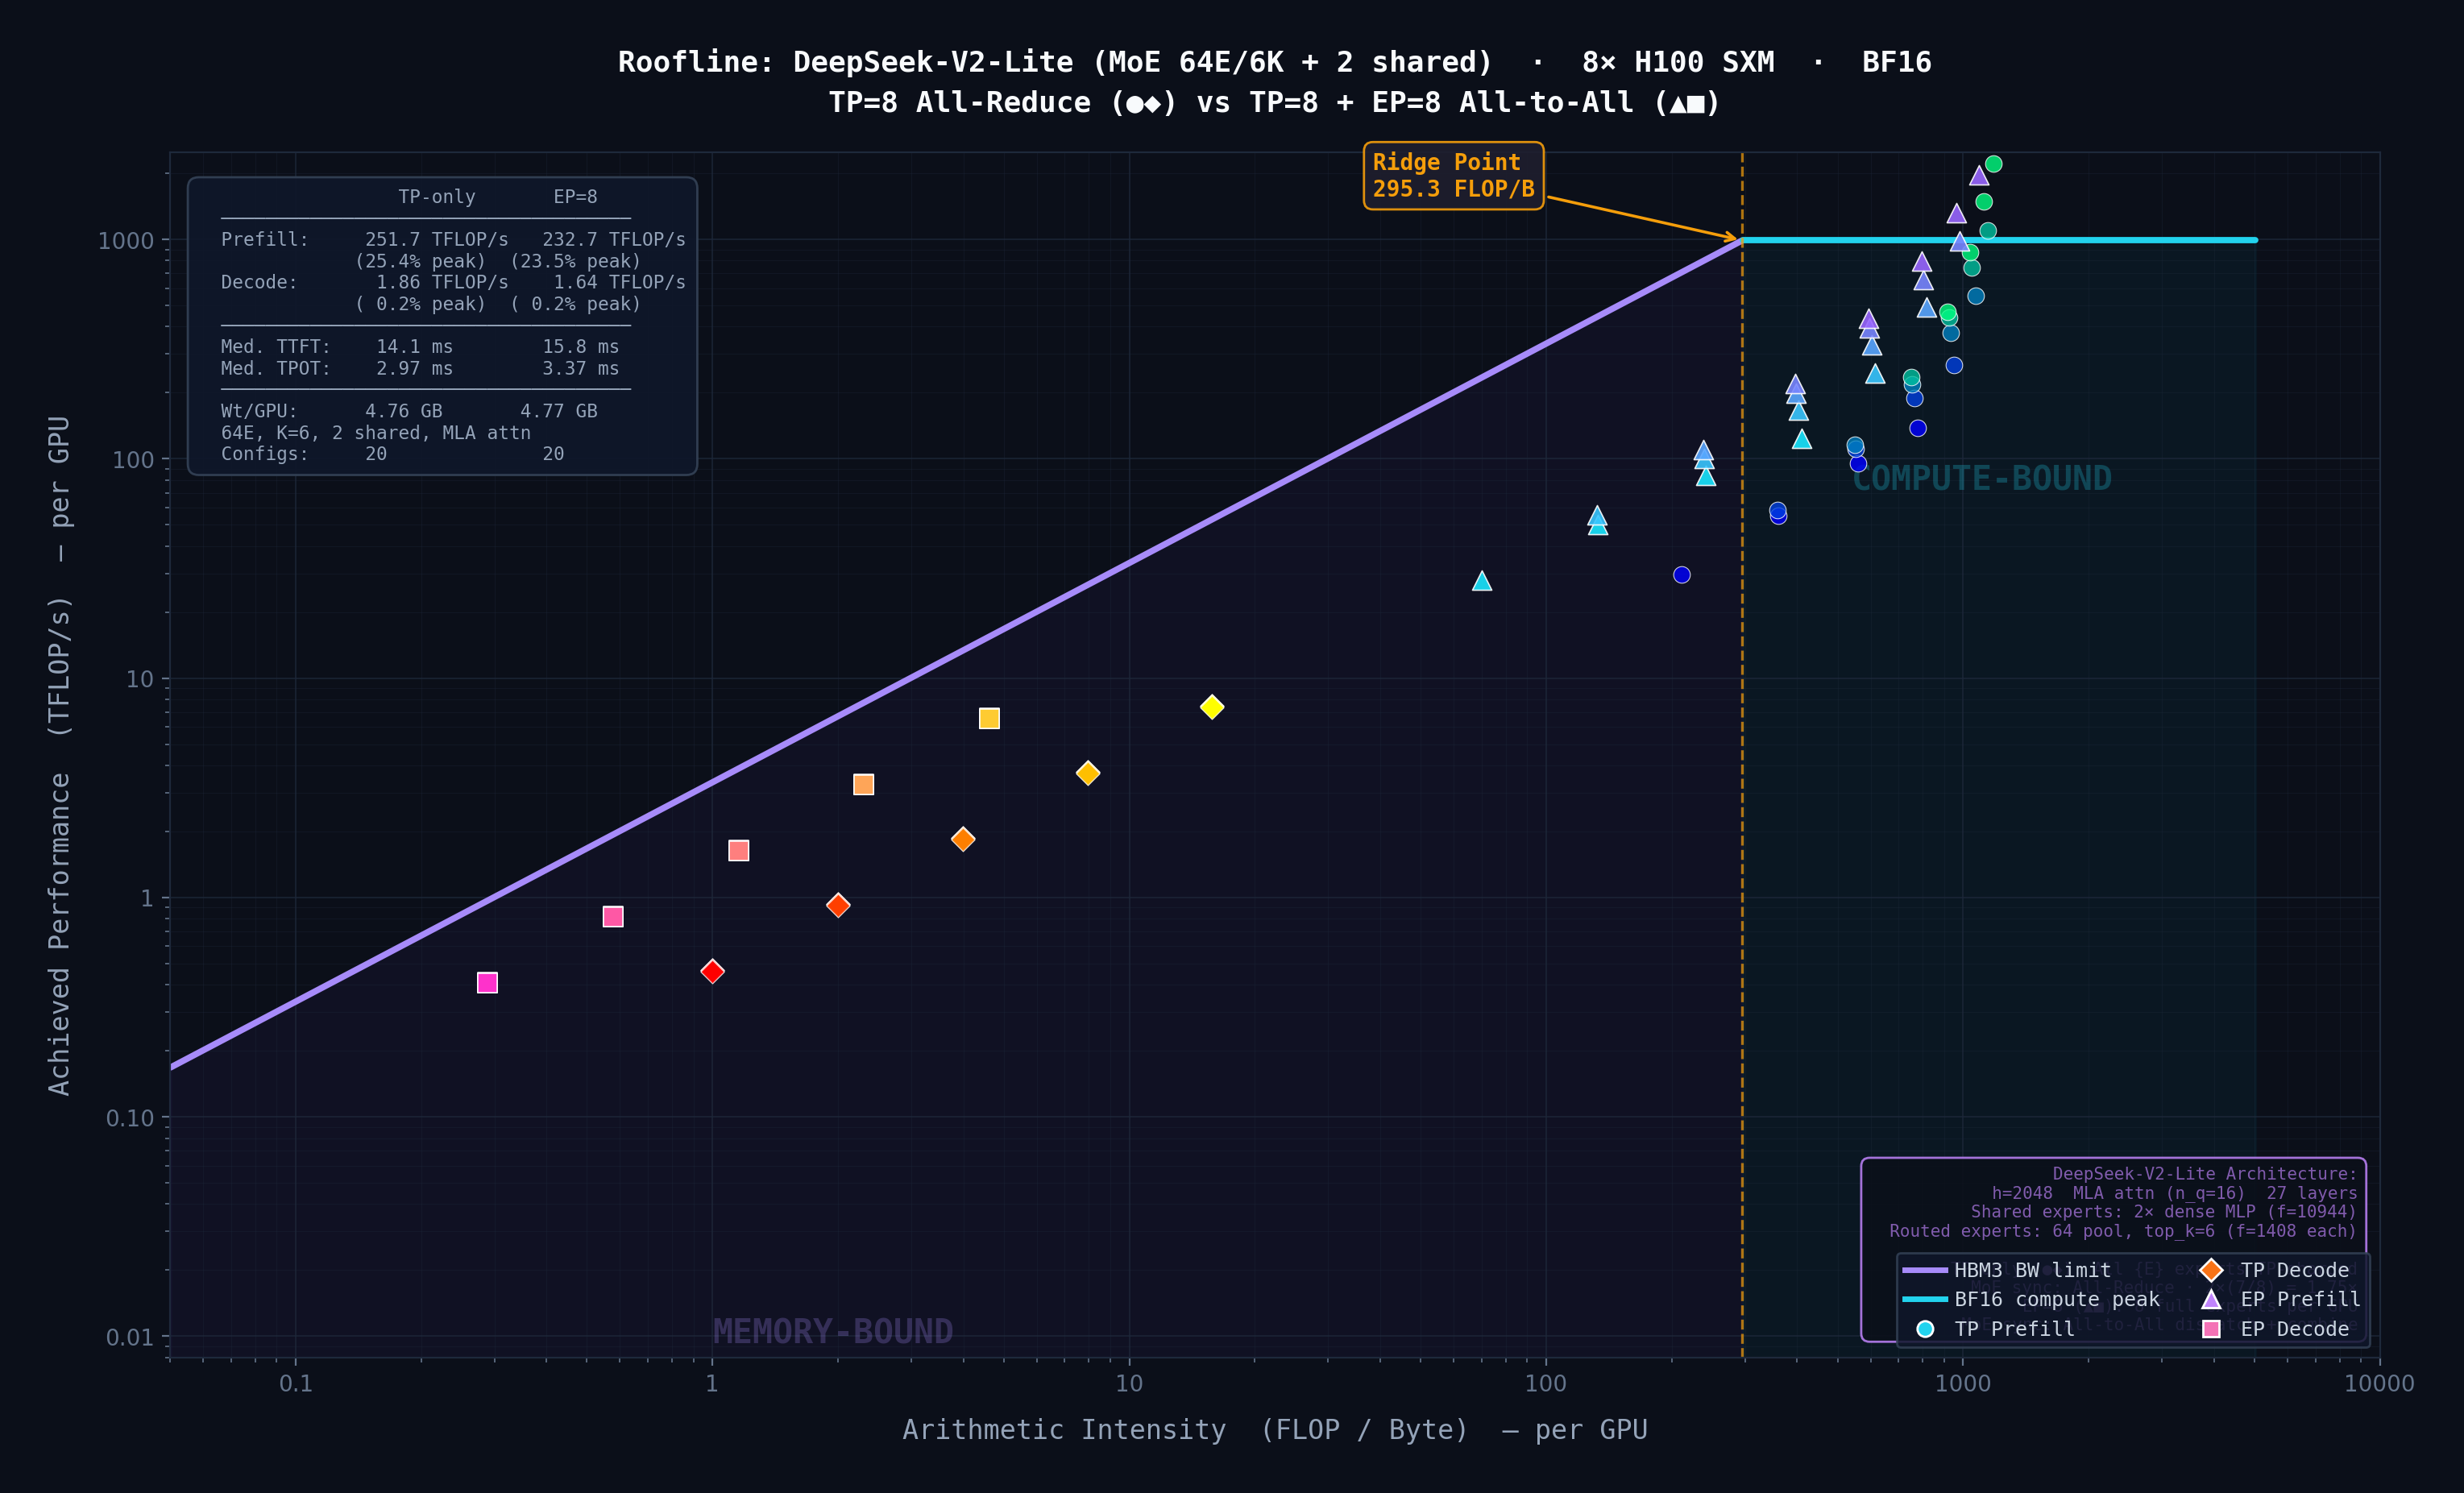
Phase 2: Roofline Modeling
Extended a simulator with a layer-by-layer Roofline model to classify layers as compute- or memory-bound. Finding: Expert Parallelism overhead scales with expert intermediate size, not expert count.
Summer 2026